
Studies Fail to Support Claims of New California Ethnic Studies Requirement
A law mandating the course for all public high school students is based on two unreplicated studies that distort the data
March 29, 2022

Last fall, when California Gov. Gavin Newsom signed into law a measure that could require every California public high school student to take an “ethnic studies” course to graduate, he alluded to two studies commonly cited by advocates to justify the measure, claiming the research shows that ethnic studies courses “boost student achievement over the long run—especially among students of color.” The studies—one from 2017 by Thomas Dee of Stanford University and Emily Penner of University of California, Irvine, the other a follow-up from 2021 by Dee, Penner, and Sade Bonilla of the University of Massachusetts, Amherst—purport to show that ninth-grade students who took an ethnic studies course in San Francisco public schools experienced dramatic short-term and long-term academic benefits. The studies also make the stunning claim that the ethnic studies course causes an average increase of 1.4 GPA points, miraculously turning C students into B+ students.
But the experiment on which these conclusions are based is so muddled, and the data reported is so ambiguous, that in fact they support no conclusion, either positive or negative, about the effects of this particular ethnic studies course in these particular schools and times. Indeed, not even the lead author claims that the studies provide a basis for establishing ethnic studies mandates for all students. Nevertheless, a proposal to make ethnic studies a prerequisite for admission to the University of California—currently before the UC Academic Senate—uses the results of both the 2017 and 2021 studies to claim that “by requiring all future UC applicants to take an ethnic studies course, UC can uplift the outcomes of students of color.”
Social science research often generates controversial results, because particular findings can often be legitimately interpreted in multiple ways. This is not the case here. There are well-established, objective methods for evaluating the effects of new programs, and reporting upon and interpreting the results of those evaluations. Those methods were not followed in the Dee-Penner-Bonilla research. The work they present fails many basic tests of scientific method, and it should not have been published as written, much less relied upon in the formulation of public policy.
Below we explain what the study authors did, and how their work is fundamentally flawed along three different dimensions: the way their “experiment” was designed, the way they reported their results, and the interpretation of their results. In each of these areas, the authors made multiple serious errors. Far from demonstrating the value of ethnic studies courses, these studies merely demonstrate how easy it is in our overheated political environment to subvert statistical analyses for political purposes.
In their 2017 study, Dee and Penner made the following headline claim: “Assignment to [an ethnic studies] course increased ninth-grade attendance by 21 percentage points, GPA by 1.4 points, and credits earned by 23.” The authors call these effects “surprisingly large.” (No less audaciously, the 2021 paper claims that being “eligible” for an ethnic studies class—apparently whether or not one actually took it—raised high school graduation rates by 16 to 19 percentage points.) These are the only understatements in their papers. The claimed effects are huge, and go a long way to explain why the papers have had such a large impact. If they were true, they would indeed be powerful arguments for ethnic studies; it is hard to think of any other comparably modest intervention, in the entire education literature, that claims such large and transformative effects. Unfortunately, the effects are not merely greatly overblown—they plausibly do not exist at all. If the ethnic studies intervention had any effect, a much more careful study would be needed to measure them.
In 2010, the San Francisco Unified School System launched an ethnic studies curriculum at five of its 19 high schools. In three of the schools, the course was a yearlong elective taken by about a quarter of the ninth graders. At those schools, eighth graders with GPAs under 2.0 were “assigned” to take the ethnic studies course in ninth grade, but they were allowed to opt out and some 40% of the students did so. Eighth graders with GPAs above 2.0 were not assigned to the ethnic studies course, but they could “opt in,” and a little more than 10% did so, signing up for the ethnic studies course in lieu of their regular social studies course.
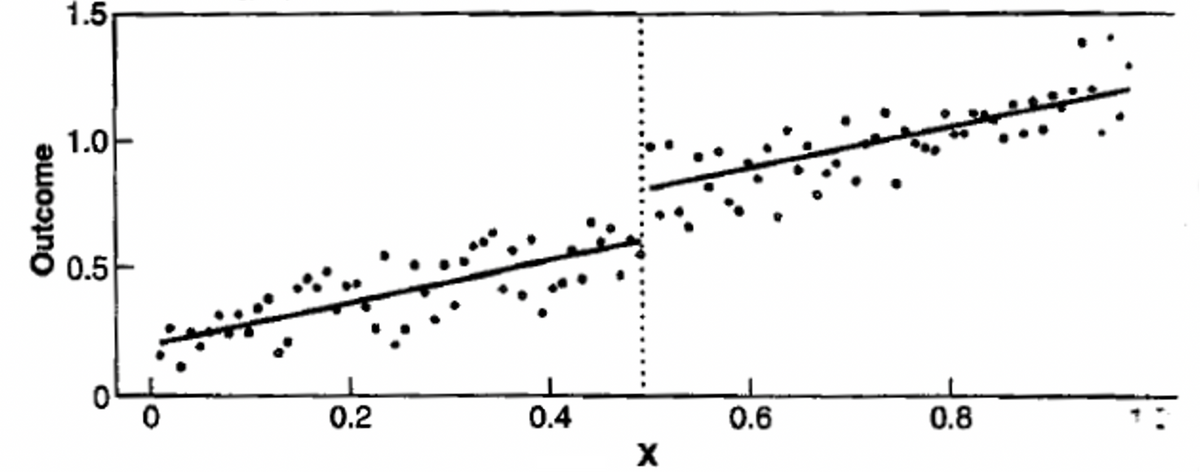
How might one have studied the effects of this initiative? In a controlled experiment, a subset of ninth graders at the three high schools would be randomly assigned to either a treatment group that would take the ethnic studies course, or a control group that would take the usual social studies course. Obviously, that isn’t present here. A second-best condition would occur if all students with some characteristic (like an eighth-grade GPA below 2.0) were required to take the ethnic studies course, and students with GPAs above 2.0 were not permitted to take the course. This would permit a natural experiment using GPA as an instrumental running variable: One could compare the outcomes of students just above, and just below, the 2.0 line where the academic strengths of students are arguably comparable, differentiated only by small random effects, making the study “naturally” random. If there were a sharp difference in outcomes on either side of the 2.0 line, one could make a plausible argument that the “treatment” (here, the ethnic studies course) caused the difference. This would be a powerful approach particularly if there were large numbers of students taught by many teachers across many schools taking the ethnic studies class.
In the Dee-Penner-Bonilla research, these conditions are not met. Instead, there are at least three challenges that make any kind of valid experimental inference very difficult, if not impossible.
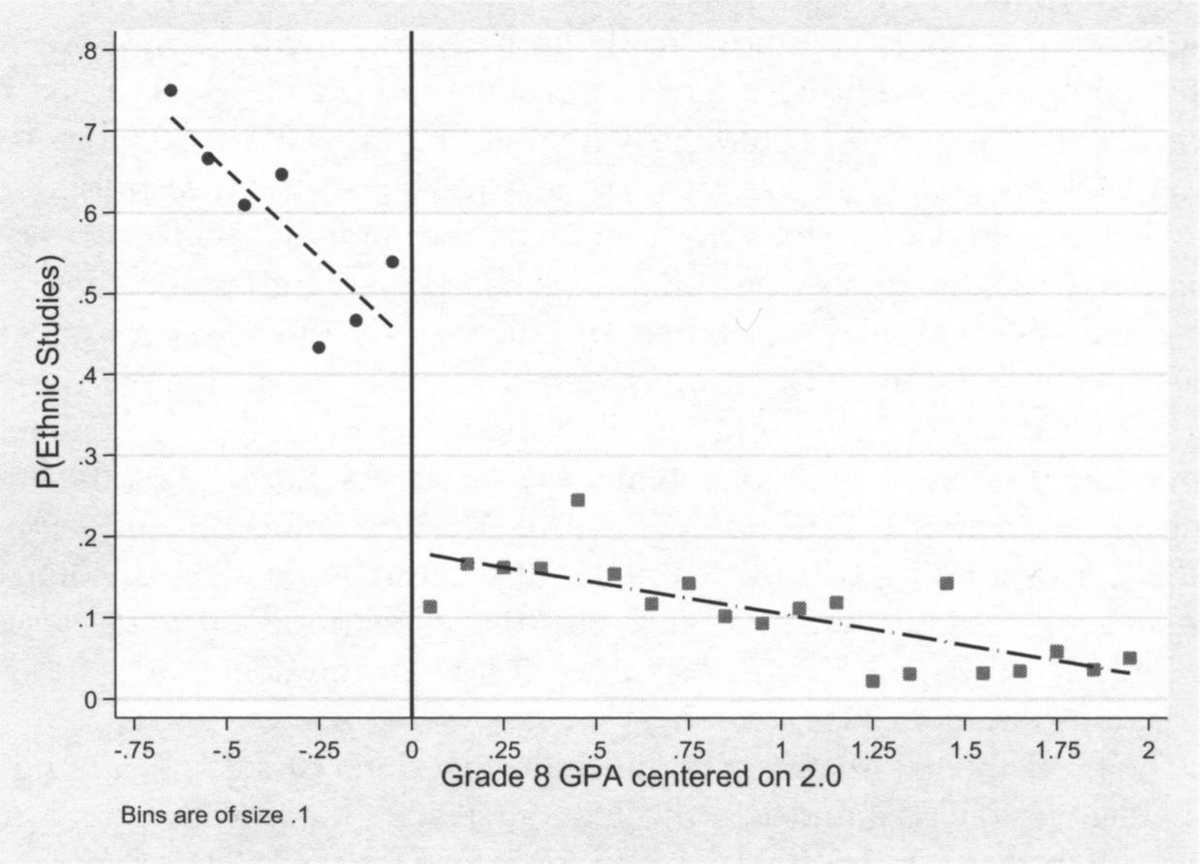
First, there is internal variation in treatment within the experimental and control groups. As we have noted, the ethnic studies “treatment” did not apply to some students who were below the 2.0 threshold, and did apply to some students who were above the 2.0 threshold. This is problematic in and of itself, but what makes this experiment especially difficult is that there is systematic variation in participation rates within the treatment and control groups. Figure 2 below illustrates the problem. To make matters worse, the rate at which the treatment applied varied within the “experimental” (below 2.0) and “control” (above 2.0) groups in a way that was itself related to GPA. As the reader can see, students in the experimental group were more likely to “opt out” of ethnic studies as their GPA approached 2.0, and students in the control group (above 2.0) were less likely to “opt in” to ethnic studies as their GPA increased. This creates a very messy, hard-to-analyze experiment, where causal effects are difficult to discern.
Second, the samples are very small. Although Dee-Penner-Bonilla highlight that their study involved 1,405 students, the fine print discloses that only 112 of those students had eighth-grade GPAs below 2.0, and only about three-fifths of those students took the ethnic studies class (i.e., around 67 students). Indeed, the majority of the students who took the ethnic studies class were in the supposed “control” group! (Nearly 1,300 of the students in the study had eighth-grade GPAs above 2.0, and about 120 of those students took the ethnic studies course as an elective.) And because so few students and schools were involved, only four teachers taught the courses, so it is hard to disentangle “teacher” effects from “course content” effects.
The small number of students involved in the studies forced the authors to substantially broaden the range of students compared in their regression discontinuity analysis. Rather than focusing on students just above or below the 2.0 threshold (for example, students with eighth-grade GPAs between 1.85 and 2.15), the authors generally compare students over a range from 1.25 to 2.75 eighth-grade GPAs. But as Figure 1 illustrates, the students in the 1.25-2.0 cohort have large internal variation even in their participation rates, so the breadth of the comparison groups, in and of itself, makes the authors’ analyses and conclusions highly suspect.
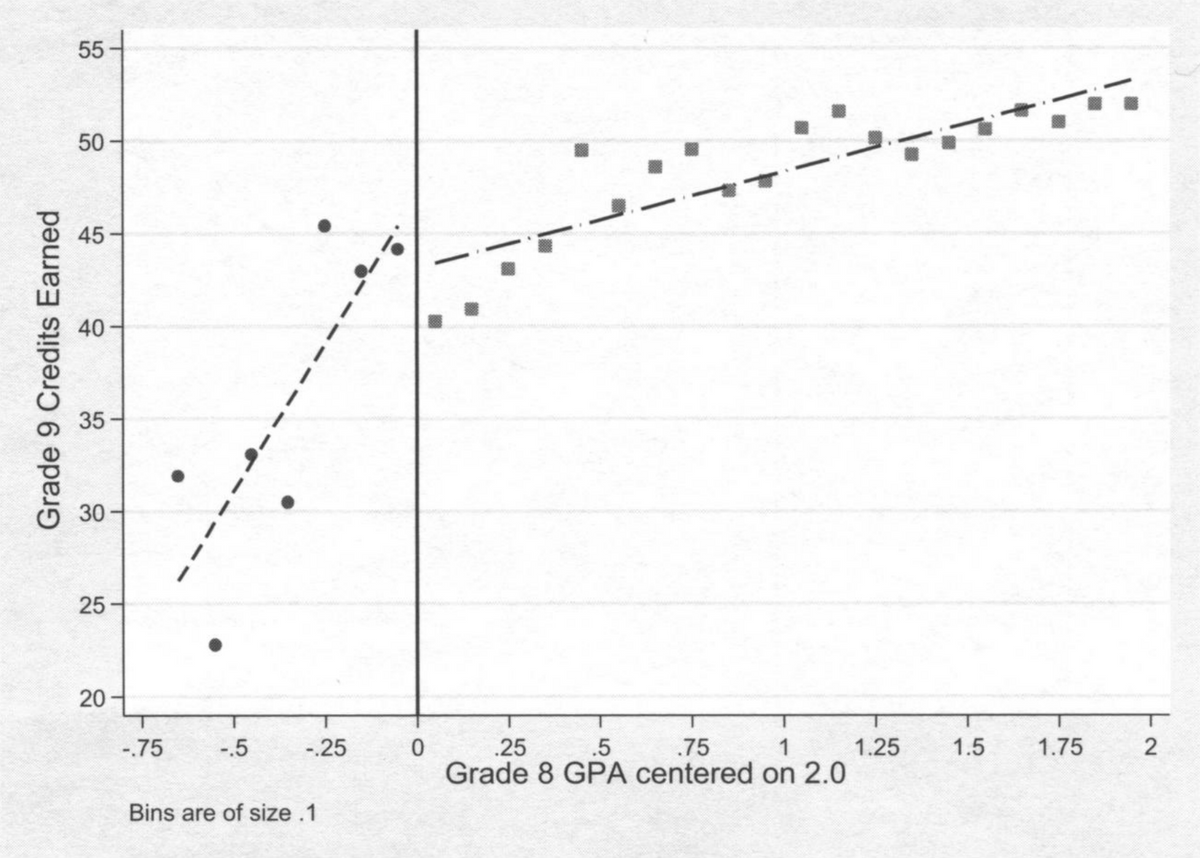
Third, the effects are nonlinear. Although the authors use GPA as an instrument, nearly all of the effects they are interested in measuring vary in nonlinear ways with GPA (see, for example, Figure 4 below). Since the authors do not have a theoretical explanation for these nonlinear effects, they essentially let their regressions “fit” the data, using flexible splines and other nonlinear methods. This substantially increases the chances that observed effects are spurious—coincidences, in other words, rather than real effects that are logically grounded and predicted by external evidence.
Many studies suffer from one of these three problems, but can still provide useful results if the designs and data are otherwise strong. But a design with all three of these problems tells us that—even absent the other serious issues discussed below—the basic design of the Dee-Penner-Bonilla experiment is too flawed to generate valid inferences about the academic effects of the ethnic studies course.
Then there is the issue of data reporting. Dee-Penner-Bonilla note that they cannot share their data, because it is administrative data for which they needed to sign a confidentiality agreement. This is a serious shortcoming. An increasing number of peer-reviewed journals require authors to make their data available; in our own research, we go to great lengths to make our data easy to share with other scholars, or create versions of the data that moot confidentiality concerns. (For example, one can blur data by adding small random errors to individual observations, or one can provide detailed descriptive statistics on cohorts within the dataset.) Without some form of data sharing, it is impossible to replicate or even deeply understand a scholar’s results, and the high rate of nonreplicability in social science studies has been widely recognized in recent years as a serious problem. But beyond this general problem, there are three more specific and disturbing oddities in the Dee-Penner-Bonilla data reporting.
At first glance, one might wonder why Dee-Penner-Bonilla did not simply compare the outcomes of students taking the ethnic studies course, and those not taking the course, and control for eighth-grade GPA. That would provide a cleaner comparison of control and treatment groups. They were, however, correct not to do so, because of the problem of “self-selection.” Students who variously chose to take the course by default, to opt out, or to opt in, might all be different in ways difficult or impossible to observe; that is why the authors selected the much messier approach of comparing students above and below the 2.0 GPA threshold.
That said, it is still highly relevant in evaluating their results to know, and be able to compare, the performance of the ethnic studies course takers and nontakers. In particular, we need to know whether there are practically important differences in outcomes between takers and nontakers that are not easily explained by chance variation or any other reason. Between the two papers, there is only one point at which this issue is addressed. In the 2017 paper, one table (11) presents regression discontinuity estimates broken down by students who did and did not take the ethnic studies class. Based on the reported numbers, the difference in coefficients between these two groups is not statistically significant (they are much less than two standard errors apart). But this fact, which by itself strongly suggests that the ethnic studies course had no significant impact, is never even discussed by the authors.
It is especially odd that the authors did not disclose and discuss differences between low-performing students who did and did not take the ethnic studies course, because the high schools in the study apparently pursued other interventions aimed at assisting students with low GPAs. (Dee and Penner allude to these other interventions on page 150 of their 2017 article, but provide no details about what the interventions were.) Yet Dee-Penner-Bonilla never provide this information; indeed, they assume, without documentation, that all of the positive effects observed in groups composed of course-takers and course-non-takers accrued to the course-takers. This glaring hole in the studies should, all by itself, have led to revision of the articles by any journal that properly reviewed them.
The degree to which Dee-Penner-Bonilla are muddled on this point is illustrated by their language. Across the two articles, they sometimes claim they demonstrate an effect of being “assigned” to an ethnic studies course (i.e., having an eighth-grade GPA below 2.0), while other times they claim an effect from “enrolling” in an ethnic studies course. As we show below, the authors’ headline results are meant to describe enrolled, not assigned students, but they get there by wildly illogical means.
Another crucial way of gaining perspective on the results reported by Dee-Penner-Bonilla is by comparing the students in their “treatment/control” groups with students from the prior year. As we demonstrate, there are many odd patterns in the reported data, some of which drive the authors’ results. Comparison with prior years could help us understand whether these oddities are typical and representative of student performance, or not. Indeed, with prior-year data, the authors could have undertaken a “difference-in-difference” analysis, which might have given their messy “below 2.0”and “above 2.0” comparisons a little more foundation. But the authors never provide any data on prior cohorts.
The closest the authors come to allowing the reader some sense of what their data contains comes in a series of graphs, a few of which are reproduced below. They also report summary statistics (mean, standard deviation, minimum, maximum) on some key variables. The reported data is, in a word, strange. For example, in Figure 3 below (Figure 3a in the 2017 article), the relationship between eighth-grade GPA cohorts and the corresponding ninth-grade GPAs. Recall that Dee and Penner claim that taking an ethnic studies course raised ninth-grade GPAs by 1.4 points. Yet in the graph, every cohort in the “treatment” range (below 2.0) has an average ninth-grade GPA that is lower than the corresponding eighth-grade GPA. For example, students with an average GPA of 1.65 in eighth grade, 65% of whom took the ethnic studies course, had an average ninth-grade GPA of 1.1.
It’s hard to see how this makes any sense. Part of the explanation, one can infer from the reported summary statistics, is that ninth-grade GPAs varied much more than eighth-grade GPAs, and some students in the study apparently earned zero credits and/or had GPAs of 0.0. Even if this is a partial explanation, it suggests that there are many odd things going on with the data, large outliers, and huge variations in individual outcomes, which in turn means that readers need to be provided with much more detail, such as scatterplots of individual outcomes, rather than the very opaque presentation using ecological variables (i.e., group averages rather than individual data).
Setting aside the issues of experimental design and data reporting, do the results themselves make any sense? As noted above, Dee and Penner contend that taking an ethnic studies course produced enormous effects on student grades, credits taken, and attendance rate. The grade effect, they claim, is 1.4 points—enough to change a C student (2.0 GPA) into a B+ student (3.4 GPA). Let’s examine the data on which this near miraculous claim is based: Figure 3a from the 2017 paper (Figure 3 below).
As in Figure 2 above, each dot represents students over a one-tenth of a point interval of eighth-grade GPA. Thus, the first dot to the left of the black line represents students with eighth-grade GPAs of 1.9 to 2.0, (which we call the “1.95” cohort) and the location of the dot tells us that those students, on average, had a ninth-grade GPA of about 1.6. What can we infer from the data in Figure 2?
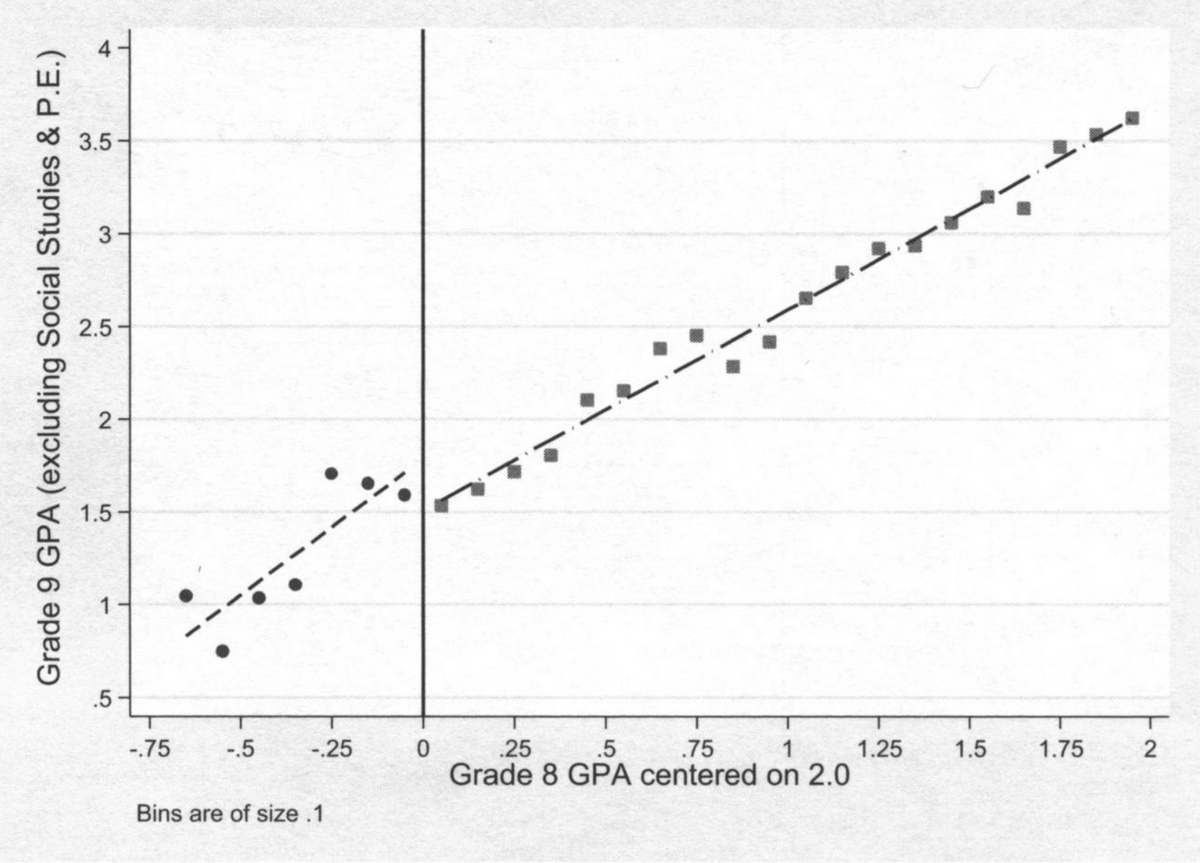
First, the students just below and just above the 2.0 (“0”) black line have nearly identical grades. Cohorts 1.75, 1.85, and 1.95 together have a ninth-grade GPA of about 1.6, and so do the cohorts 2.05, 2.15, and 2.25. The differences are neither practically nor statistically significant. This is not the end of the story, of course, because in a regression discontinuity design, the differences in GPA on either side of the 2.0 line are accounted for with a model. The point we’re making here is that the result depends entirely on the model and there is nothing at all without it, which is rather odd considering the huge size of the claimed effect.
Second, among the dots to the left of the “0” all but two would lie reasonably close to the right-hand-side line if it were extended across the entire graph. Dee and Penner’s line on the right-hand side of the graph shows the relationship between eighth-grade and ninth-grade grades for students who generally did not take the ethnic studies class. If we extend the line to the left of the “0,” five of the seven observations cluster around it with no positive bias as would be expected if ninth-grade GPA were to be higher than expected. At best, Dee and Penner are finding only two positive outliers (1.75 and 1.85). Yet, even these students, notably, have much lower ninth-grade GPAs than their eighth-grade GPAs. Furthermore, these two positive groups of students also had much lower enrollment in the ethnic studies class than the other “treatment” students with lower eighth-grade GPAs. It is questionable, therefore, that the data provide any support for a beneficial GPA effect from taking an ethnic studies course.
How, then, did Dee and Penner not only find an effect, but find such an enormous one? Through a very odd and statistically unjustifiable extrapolation. First, the authors fit lines to the points to the left and the right of the “0” line (shown in Figure 3). Second, both lines are extended to intercept the “0” vertical line. The left-side line intercepts the “0” line at about 1.85; the right-hand line intercepts the “0” line at about 1.47. From this, Dee and Penner infer that if there had been two groups of 2.0 eighth-grade GPA students, one group encouraged to take the ethnic studies course and the other not, they would have had a ninth-grade GPA difference of about 0.387 (derived from a multivariate regression). They then estimate that the participation rate of the two hypothetical groups of 2.0 eighth-grade GPA students in the ethnic studies course would differ by about 27%—this number being the difference between the two lines in Figure 2 extrapolated to the 2.0 vertical line. They then assume that all of the positive effect on the “treatment” group was in fact entirely due to the treatment; in other words, that the 27% greater share of students taking the ethnic studies course accounted for all the GPA gains of the group. This leads them to divide the 0.387 gain (from the discontinuity regression gap) by 0.27, producing the reported 1.4 point effect. The “C” students are thus transformed into “B+” students. This little magic trick, used to magnify a small bump into a giant transformation, has no basis in statistical theory or application.
Every step in this calculation is bogus, both for reasons we have discussed (e.g., the lack of any documentation of a significant difference in performance between students who did and did not take the ethnic studies class) and for additional reasons: For example, the relatively high slope of the line to the left of the ”0” line is entirely driven by the very poor ninth-grade GPAs of the students in the eighth-grade GPA bins of 1.25 to 1.65. Under the model specified by Dee and Penner, the better those cohorts perform, the lower the estimated effects of the ethnic studies course become! In other words, the result entirely depends on the very weak performance of those students most likely to take the ethnic studies course. If this sounds nonsensical, that’s because it is.
The 2017 Dee-Penner paper also claims that taking the ninth-grade ethnic studies course produced large increases in credits earned and rates of attendance. These assertions are even more unfounded than the claim on GPA. Figure 4 below (Figure 4a from the 2017 paper) shows the results for credits earned. As the reader can see, the credits earned for students just below the “0” threshold (i.e., students with eighth-grade GPAs of 1.7 to 2.0) average about 44, perhaps 1 or 2 credits more than would be expected if we extended the line to the right of the “0” threshold to the left-hand side of the figure. The positive effect is small and probably not statistically significant; moreover, it is dwarfed by the dramatic drop-off in credits earned below the 1.75 cohort (i.e., the four points farthest left in the figure). These students had average credits in ninth grade of about 30, far below what would be expected by extending the trend established on the right-hand side of the figure.
Recall that these are the students with the highest participation in the ethnic studies class. Since we have no comparison data for earlier cohorts, we do not know if there is a highly nonlinear relationship between eighth-grade GPA and ninth-grade credits, or if there is a very harmful effect from the ethnic studies class. (Note that statistical significance is very hard to assess here because, among other reasons, there is no genuine probability sample. The effective “sample” size is also very small indeed if the clustered nature of the data is properly considered, which Dee and Penner fail to do.) Without more data, the most plausible explanations are that the ethnic studies course has either no effect, or a harmful effect. But here again, Dee and Penner turn these terrible results into fake “good” results by estimating the effect of the ethnic studies course on 2.0 students as an extrapolation of the improvement trend among students over the 1.3 to 2.0 interval. The absurd conclusion—that the ethnic studies class increased student credits earned by 23 (!)—depends entirely on the extremely low credits earned by the students most likely to take the ethnic studies course. Once again, it is utter nonsense.
The story is essentially the same for the third Dee-Penner outcome (attendance), and interested readers can see this by consulting the original paper.
The 2021 Dee-Penner-Bonilla paper reported new findings from the same experiment by carrying the observation period for the students four years forward from ninth grade. All of the problems in experimental design and data reporting discussed above apply equally to both papers. The problems discussed below—what data inferences are drawn from the data—are somewhat different. The “GPA effects” are not reported or discussed, perhaps because they disappeared after ninth grade. The extrapolation of effects based on the presumed noneffect among students not taking the ethnic studies course is mercifully gone as well. In this respect, the 2021 study is less reckless than the 2017 study. On the other hand, the significance of many of the 2021 results depends entirely on the particular model chosen; some models show no statistically significant patterns, while others do; the authors highlight the significant patterns, but without any convincing rationale for doing so (see Table 4 of the 2021 paper). They certainly do not undertake any statistical analysis that adjusts for the fact that they are performing a statistical inference while at the same time selecting among various difference models.
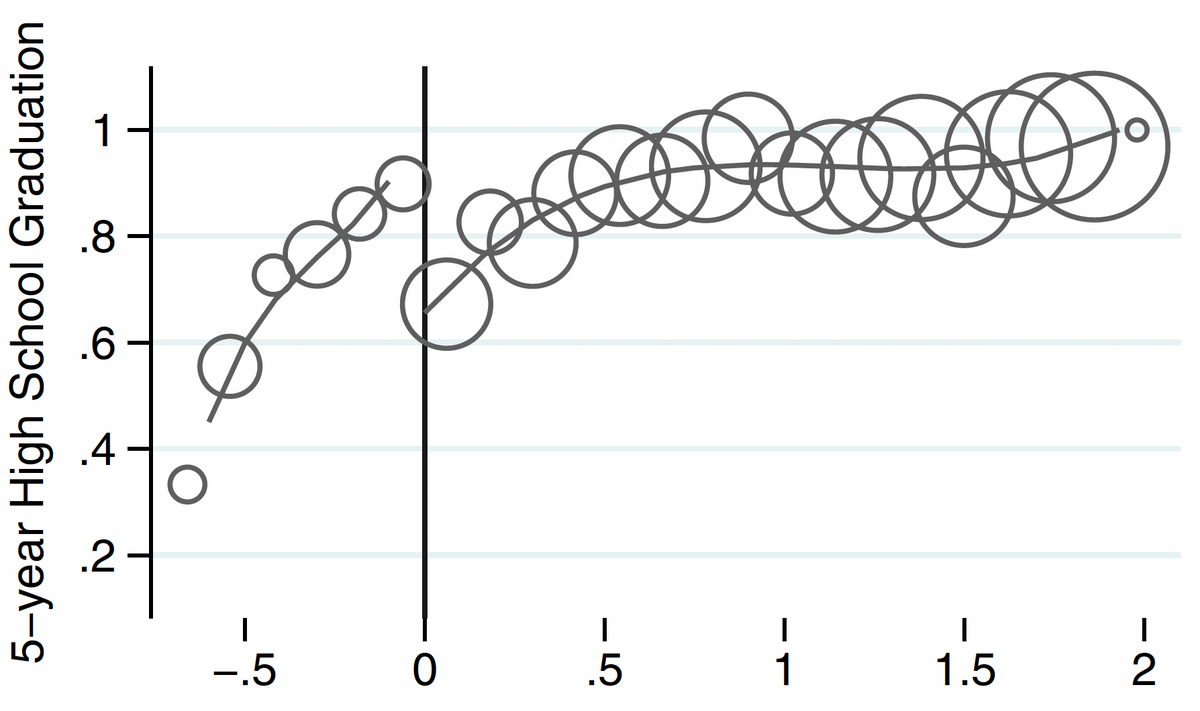
To a casual reader of the 2021 paper, the most impressive result the authors report is the “graduation rate” effect; the data behind this is shown in Figure 5 below. As the reader can see, the graduation rates of students to the right of the 2.0 line rapidly fall as they come closer to the line, while the graduation rates of students to the left of the 2.0 line are much higher and fall more slowly. Thus, the students with eighth-grade GPAs of 1.95 (in the “experimental” group) appear to have a 90% graduation rate, while the students with eighth-grade GPAs of 2.05 (in the “control” group) appear to have graduation rates of about 65%—a massive rate difference of 25%.
Something interesting is going on, but there are two big problems in attributing this effect to the ninth-grade ethnic studies class. First, recall that the difference in participation rates in the ethnic studies class between the “just under” 2.0 cohorts and “just over” 2.0 cohorts is modest—perhaps 25%-40%, and about half of the students in the “just under” group did not take the ethnic studies course. Thus, it is not mathematically possible for the just sub-2.0 cohort to have greater than a 90% graduation rate unless the non-ethnic studies course-takers in those cohorts also had high graduation rates—at least 80% and probably higher, which is also a lot higher than the graduation rate for the “just-over” cohort. Obviously, whatever produced this apparently large bump in graduation rates could not have been caused exclusively or even mostly by the ethnic studies course. In fact, considering the small number of students on either side of the threshold and the clustered nature of the observation (into a small number of classes, teachers and schools), the apparent effects may all just be chance variation and not all likely to replicate in other schools, with different teachers and at future times.
Second, we are told that the participating schools undertook other interventions to improve persistence among low-GPA students. This seems like a much more plausible explanation of the observed effects, but it is dismissed by the authors, without documentation, on the grounds that those interventions were ineffective at other schools. Clearly, however, something at the experimental schools produced these cohortwide effects. The authors, in ignoring the sheer illogic of their key conclusion, pass from the realm of social science to polemics.
Even the purported effects of the ethnic studies course are only analyzed for students who are struggling academically—the students in the bottom fifth or so of their eighth-grade classes as measured by eighth-grade GPA. Dee, at least, has been careful to note on several occasions the preliminary and limited generalizability of the research. We do not know if the authors have made attempts to dissuade the advocates who have used their study to justify universal ethnic studies requirements, but clearly no such justification is warranted even by the authors’ claimed results. Indeed, the one thing their data tells us about an ethnic studies course is that very few ninth graders who were performing well in the eighth grade chose to enroll in the ethnic studies course in ninth grade (see Figure 1). The strong negative relationship between GPA and interest in the course tells us something, perhaps, about the perceived academic value of the course. Understanding what students actually learn in an ethnic studies course, and how that compares with learning in the social studies courses that are presumably displaced by an ethnic studies course, are important subjects for investigation.
The enormous attention and influence generated by the Dee-Penner-Bonilla research might be justified if the authors had obtained extraordinary results from an exceptionally well-designed, highly transparent, and easily replicable study. But what we have here is the opposite: an exceptionally messy experimental design, opaque to analysis or replication, reporting data patterns that are unbelievable on their face, and which seriously distorts the actual data results.
To us as scholars, perhaps the most disturbing aspect of this affair is that the studies were published in their current form. In particular, why did the usual safeguards of peer review fail so badly to screen out this research? How could the editors, who are presumably respectable academics, allow the publication of a sentence this extraordinary: “Our results indicate that assignment to this course increased ninth-grade student attendance by 21 percentage points, GPA by 1.4 grade points, and credits earned by 23.”
We are not sure, but here are some possible answers.
First, Thomas Dee, at least, is a respected research scientist. He holds a chair at Stanford’s Graduate School of Education. Journal editors and peer reviewers, assuming the peer review was not blind, might simply have expected him to know what he was doing.
Second, the articles are shrouded in a great deal of highly technical jargon. The methods employed appear to be highly sophisticated, but the results are cherry-picked, model checks aren’t made, and the fundamental absurdity of reporting such large effect size is ignored. One needs to read closely, and to be familiar with how regression discontinuity analysis is properly done, to readily see the authors’ sudden jumps in logic, and their errors of methodology and analysis. Unfortunately, editors and reviewers do not always devote the care they should to evaluation; they can be taken in by a respected name and seemingly impressive results.
Third, and most unfortunately, review standards are often weakest on topics of strong ideological valence. The controversy over mandated ethnic studies courses is a new and fraught topic; editors and reviewers sympathetic to a particular conclusion may either ignore weaknesses in an article, or assume that anything that seems odd in the analysis simply reflects their own incomplete understanding of the authors’ methods, rather than a serious defect.
Whatever the causes, the publication of these two astoundingly shoddy works and their importance to the ethnic studies movement should raise the alarm—not only that the editing and peer-review process at these two journals needs overhauling, but that California parents are not being told the truth about a potentially significant change in the education of their children.
Richard Sander is the Dukeminier Distinguished Professor of Law at the University of California Los Angeles and Co-Director of the UCLA-RAND Center on Law and Policy.
Abraham Wyner is Professor of Statistics and Data Science at The Wharton School of the University of Pennsylvania and Faculty Co-Director of the Wharton Sports Analytics and Business Initiative.


